(Indian Economy) Poverty And Unemployment - Lorenz Curve, Causes of Poverty, Labour Reforms, NREGA
INDIAN ECONOMY
POVERTY AND UNEMPLOYMENT
Poverty is a state of pronounced deprivation in terms of command over commodities in general. A greater command over resources implies lower level of poverty and vice versa. As such, poverty is measured on the basis of income or consumption by adopting a threshold in monetary terms which in India is per capita household expenditure.
The definition of Poverty Line has caused extensive debate in the country as estimates of per capita household expenditure have been unrealistic. The latest estimate in this regard is the Rangarajan Committee Report in 2014 according to which, the poverty line should be Rs. 32 per day in rural areas and Rs. 47 in urban areas, as against the earlier estimate of Rs. 27 and Rs. 33 respectively. The Rangarajan Committee’s methodology to calculate poverty line is based on parameters like clothing, house rent, conveyance, education, adequate nourishment, average calorie requirements, protein and facts etc. a household has been considered poor if it is not able to save. Poverty is both absolute and relative. The former is defined on the basis of poverty line while the latter is defined on the basis of inequalities i.e. households whose income is less than the average income of society.
Inequalities in society are measured by Lorenz Curve shown below:
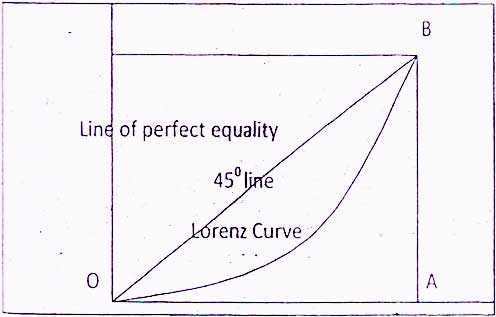
At straight line at an angle of 45o from the start on the graph indicates perfect equality. The curve below this line shows inequality. The greater the inequality, the greater will be the degree of curvature.
A coefficient based on the Lorenz Curve is called Gini Coeffcient which measures inequalities as follows:
| G = |
Area OCB |
|---|
If the frequency distribution is equal, the Lorenz coincides with the 45o line and G=0.
The official method to estimate poverty above is the Head Count Ratio (HCR) which is calculated by diving the number of people below the Poverty Line by the total population. This is the proportion of poor in the total population. Head Count Ratio makes no distinction between people just below Poverty Line and those much below Poverty Line. This distinction is appropriately brought out by an index called Poverty Gap Ratio which is calculated as the average difference between Poverty Line and actual income or consumption for all poor households, expressed percentage of the Poverty Line. In other words, it is defined as the mean distance the Poverty Line expressed as a proportion of that line (where the mean is formed over the entire population, counting the non-poor as having zero poverty gaps). The poverty gap thus measures the transfer that would bring the income of every poor person exactly up to the Poverty Line.
The Planning Commission is the nodal agency for estimating the number and proportion of people living below the Poverty Line at National and State levels. Separately for rural and urban areas. Poverty estimates are based on a large sample survey of household consumption expenditure carried out by the National Sample Survey Organisation (NSSO) after an interval of approximately five years.
The Planning Commission has updated the poverty lines and poverty rates for 2011-12 based on the recommendations of Tendulkar Committee. Accordingly, with the Poverty Line at all India level at monthly per capita expenditure of Rs. 816 for rural areas and Rs. 1000 for urban areas in 2011-12, the poverty ratio from 37.2 percent in 2004-05 to 21.9 percent in 2011-12.
According to Human Development Report, severe poverty remains a major problem throughout much of the development world. An estimated 1.57 billion people or more than 30 percent of the population of the 104 countries live in multidimensional poverty, including 612 million in India. On the newly constituted Multi dimensional poverty Index (MPI), which Identifies multiple deprivations in the same households in education, health and standards of living. Only 29 of the 186 countries do worse than India. The MPI puts India’s poverty head count ration at 54 percent which is higher than Bangladesh and Nepal.
The Human Development Report estimates the Human Development Index (HDI) in terms of three basic parameters: to live a and healthy life, to be educated and knowledgeable, and to enjoy a decent economic standard of living. India’s rank in HDI is 135 out of 187 countries in 2014. There is also the inequality adjusted HDI prepared by HDR for nearly 140 countries which takes into account loss of human development due in inequality in health, education and income.
India’s rank is lowest amongst BRICS countries and also below
the average of countries in both the medium human development groups (0.164
against India’s 0.586) and in South Asia (0.588).
In terms of gender equality, the HDR ranks India at 127 out of 152 countries.
Thus, India is in the bottom 25 percent of all countries in the HDI, it ranks in
the bottom 20 percent of the gender inequality index.
Poverty and deprivation are acute in India even in terms of Misery Index which
is prepared by combining high rate of unemployment and high rate of inflation in
a country.
Causes of Poverty
The extent of poverty in an economy is due to a wide range
of factors as follows:
(i) Underdevelopment nature of economy.
(ii) Rapid growth of population in an overpopulated country, even if the
national income increases, the capita income remains the same due to increase in
population.
(iii) Large inequalities in the ownership of earning assets such as land,
buildings, etc.
(iv) Low level of productivity in agriculture and industry.
(v) Large scale unemployment and under-employment.
(vi) Inequality of opportunity in acquiring education and skills.
(vii) State Policy.
(viii) Regional disparities.
The main determinants of poverty in a country like India
are generally reflected in terms of :
(i) Lack of income due to a lack of productive employment and under
employment.
(ii) Increasing prices of food grains which constitute the major item in the
consumption basket, and
(iii) Inadequate social infrastructure affecting the quality of life of the
people and their ability t take up gainful employment.
Among various factors contributing to poverty alleviation, economic growth in terms of its trickle-down effect has always been regarded as an important factor. However, it is not economic growth per se but also the sectoral composition of growth. If growth is concentrated more in agriculture and rural sectors. It may lead to much larger alleviation of poverty in India than if it is concentrated say, in large scale industries. Similarly, factor like physical and social infrastructure, focus on increasing productivity of small farmers, generation of employment opportunities, control of population expenditure on human development etc. help alleviate poverty to a large extent.
The Multidimesional approach to measure poverty, developed by the UNDP since 2010, has replaced the earlier index viz. Human Poverty Index viz. human Poverty Index and is based on assessing health, education and standard of living on the basis of parameters like nutrition and infant mortality (for health), years of schooling and children enrolled (for education) and toilets, water, cooking food, floor and assets (for standard of living).
Government initiative to eradicate poverty are based on cafeteria approach index which social safety net, progressive taxation, food security, special anti poverty programmes, high social sector spending, socio-economic planning, decentralization, inclusive growth, etc.
UNEMPLOYMENT
There have been structural changes in India’s employment scenario in the decade between 2004-05 to 2011-12 in the sense that for the first time, the share of primary sector in total employment has dipped below the halfway mark from 58.5 per cent in 2004-05 to 48.9 per cent in 2011-12. Employment in the secondary and tertiary sectors increased to 24.3 per cent and respectively in 2011-12 from 18.1 per cent and 23.4 per cent respectively in 2004-05. Self employment continues to dominate with a 52.2 per cent share in total employment. What is significant is the significant share of workers engaged in low-income generating activities.
The extent of unemployment in India is generally measured
on the basis of three different concepts used by the National Sample Survey
Organisation, as follows:
(i) Usual Status or chronic unemployment (in terms of number of persons)
which means number of persons who remain unemployed for a major part of the
reference period – in this case, a year.
(ii) Current Weekly Status Unemployment (in terms of number of person) which is
measured in terms of the number of persons who did not find even an hour of work
during the reference period – in this case, a week.
(iii) Current Daily Status (CDS) Unemployment (measured in terms of number of
days or person years) which means the number of persons who did not find work on
a day or some days during the Survey week. This is considered to be the most
comprehensive measure of unemployment. The 11th Plan has largely used this
measure for estimation of employment and unemployment in India. CDS estimate of
unemployment is the highest in India as this is the broadest measure.
Unemployment and underemployment in India can be
attributed to the following reasons:
(i) Low productivity in the agricultural sector,
(ii) Low employment creation capacity of the industrial and tertiary sector. For
example, while tertiary sector accounts for more than 50 percent of the national
income, it absorbs just about 20 percent of the labour force,
(iii) Defective education system implying lack of focus on vocationalisation,
(iv) Lack of manpower planning,
(v) Failure to prevent migration of labour force from rural to urban areas,
(vi) Failure to promote labour-intensive production,
(vii) Inadequate growth of infrastructure including, particularly, rural
infrastructure which could engage the growing labour force.
Generation of additional employment opportunities has been an integral part of planning strategy. It is felt that an employment-oriented strategy of economic development provides the best answer to the challenges of unemployment and under-employment. Such a strategy involves sector-specific approach focusing on sectors, regions and activities which have high employment elasticity. Agriculture and allied sectors, rural industrialisation, small-scale industries, rural infrastructure and sunrise industries are particularly identified as high employment generating sectors/activities. Not only increasing employment opportunities are to be provided, but the backlog of the unemployment exists in the rural sector and one third in urban sector.
The increasing diversification of the economy together with acceleration in economic growth has resulted in structural changes in the nature of the job market. The average annual growth rate of overall employment in both the organised and un-organised sectors has decelerated primarily due to slower growth in agricultural employment, with the absolute number of persons employed in agriculture showing a decline.
Employment in sectors like trade, transport, construction, financial services, storage and communications has grown faster than the average and the share of these sectors in total employment has increased. This reflects the structural changes in products markets in the post-reform period. For growth to be inclusive it must create adequate livelihood opportunities and add to decent employment commensurate with the expectations of a growing labour force.
Skill development has been an important plank of employment generation policy in the Eleventh Plan. The National Skill Development Council has undertaken several initiative in this regard which include training projects, skill development for early school leavers and existing workers, vocational training etc.
Sluggish Employment Growth
A cause for concern is the deceleration in the compound annual growth rate (CAGR) of employment during 2004-05 to 2011-012 to 0.5 per cent from 2.8 per cent during 1999-2000 to 2004-05 as against CAGRs of 2.9 per cent and 0.4 per cent respectively in the labour force for the same periods. After a period of slow progress during 2004-05 to 2009-10, employment generation picked up during 2009-10 to 2011-12 but not keeping pace with the increase in labour force. Based on current daily status (CDS), CAGR in employment was 1.2 per cent and 2.6 per cent against 2.8 per cent and 0.8 per cent in the labour force respectively for the same period.
There are other issues of concern like poor employment growth in rural areas, particularly among females. Though employment of rural males is slightly better than that of females, long-term trends indicate a low and stagnant growth. Such trends call for diversification of livelihood in rural areas from agriculture to non-agriculture activities. In order to improve generation of productive employment under the Mahatma Gandhi National Rural Employment Guarantee Act (MGNREGA), The Intensive and Participatory Planning Exercise (IPPE) has been initiated to prepare the labour budget for financial year 2015-16 in selected 2500 backward blocks using participatory rural appraisal technique. Emphasis has been laid on agriculture and allied activities to ensure that at least 60 per cent of the works in a district in terms of cost is for creation of productive assets linked to agriculture and allied activities through development of land, water, and trees.
A major impediment to the pace of quality employment generation in India is the small share of manufacturing in total employment. However data from the sixty-eighth NSSO round (2011-12) indicates a revival in employment growth in manufacturing from 11 per cent in 2009-10 to 12.6 per cent in 2011-12. This is significant given that the National manufacturing Policy 2011 has set a target of creating 100 million jobs by 2022. Promoting growth of Micro, small, and medium enterprises (MSME) is critical from the perspective of job creation which has been recognized as a prime mover of the development agenda in India. Although total informal employment increased between 2004-05 and 2011-12, it is significant that informal unorganized sector employment declined leading to an increase in informal organized sector employment. Consequently the share of unorganized labour has declined from 87 per cent to 82.7 per cent.
NSSO rounds are quinquennial and therefore information on the employment/unemployment situation in the country is available only after a gap of five years. To make available data in the interregnum, the Labour bureau conducts household employment – unemployment surveys on annual basis and has also been bringing out quarterly survey reports of the economic slowdown on employment in select sectors in India since 2009. The results of the latest quarterly summary on employment, July 2014, indicate an increase in employment by 3.5 million since the first survey.
The US (Unorganised Sector) unemployment rate is generally regarded as the measure of chronic open unemployment during the reference year, while the CDS (Current Daily Status) is considered a comprehensive measure of unemployment, including both chronic and invisible unemployment.
Thus, while chronic open unemployment rate in India hovers around a low of 2 per cent, it is significant in absolute terms. The Number of unemployed people (under US) declined from 11.3 million during 2004-05 to 9.8 million in 2009-10 but again increased to 10.8 million in 2011-12.
However, based on the CDS the number of unemployed person days declined from 34.3 million in 2004-05 to 28.0 million in 2009-10 and further to 24.7 million in 2011-12. Thus there has been a significant reduction in chronic and invisible unemployment from 8.2 per cent in 2004-05 to 5.6 per cent in 2011-12. Despite only marginal growth in employment between 2009-10 and 2011-12, the reason for the decline in unemployment levels could be that an increasing proportion of the young population opts for education rather than participating in the labour market. This is reflected in the rise in enrolment growth in higher from 4.9 million in 1990-91 to 29.6 million in 2012-13.
Labour Reforms
Significant improvement in industrial harmony in India is evident from the fact that man days lost on account of strikes and lockout have been steadily declining: from 17.6 million in 2009 to 14.46 million in 2011, and further to 3.65 million during 2013 and 1.79 million from January 2014 to 9 december 2014.
The multiplicity of lobour laws and difficulty in complying with them has always been cited as an impediment to industrial development in India. In a major initiative for ensuring compliance and promoting ease of doing business, the government has initiated a number of labour reform measures.
Thus amendments have been proposed to labour laws to align them with the demands of a charging labour market. Individually, states like Rajasthan have also introduced major reforms in three labour legislations: the Industrial Disputes Act, Factories Act, and Contract Labour Act.
(Salient features of various employment generation of poverty alleviation programme are given below.)
Mahatma Gandhi NREGA
This flagship programme of the government aims at enhancing livelihood security of households in rural areas by providing at least one hundred days of guaranteed wage employment in a financial year to every households whose adult members volunteer to do unskilled manual work with the stipulation of one-third participation of women. The MGNERGA provides wage employment while also focusing on strengthening natural resource management through works that address causes of chronic poverty like drought, deforestation, and soil erosion and thus encourage sustainable development. The MGNREGA is implemented in all districts with rural areas.
Mahatma Gandhi NREGA aims at providing not less than 100 days of guaranteed wage employment in financial year to every rural household, with a stipulation of one-third participation of women, through creation of assets that address causes of chronic poverty like drought, deforestation, and soil erosion, thus encouraging sustainable development. With wages indexed to the consumer price index for agricultural labour (CPI-AL), the average wage under the scheme has increased substantially over the years, resulting in improvement in the bargaining power of agriculture labour. It has also led to improved economic outcomes, especially in watershed activities, and reduction in distress migration.
Some recent initiatives under the programme are as follows:
- Inter-departmental convergence and collaboration activities like construction of individual household latrines under the Nirmal Bharat Abhiyan (NBA), construction of anganwadi centres under the Integrated Child Development Services (ICDS) Scheme, construction of village playfields under the Panchayat Yuva Krida aur Khel Abhiyan, and convergence with watershed management programmes.
- Steps to open individual bank/post office accounts for all women workers.
- Identifying and providing job cards to widowed, deserted, and destitute women.
- Initiatives for the disabled and other vulnerable persons by fixing schedule of rates (SoR) based on work and time motion study at state level.
- Adding new works to the existing list of permissible works specifically focused on rural livelihood and agricultural activities.
A review of the programme is constantly reviewed to ensure that more such activities and areas are taken up lead to creation of assets rather than mere generation of income for beneficiaries. Also, steps are taken from time to time to plug corruption and leakages of funds.
National Rural Livelihoods Mission (NRLM)
NRLM aims at organizing all rural poor households and continuously nurturing and supporting them till they emerge out of abject poverty, by organizing one woman member form each household into affinity-based women self-help groups (SHGs) and their federations at village and higher levels by 2024-25. The objective is to ensure that each family, once it is in the SHG network for a period of 6-8 years is able to achieve household food security and have 3-4 stabilized livelihoods through a strong convergence with panchayati raj institutions (PRIs).
Swaran Jayanti Shahri Yojana (SJSRY)
This scheme launched in December, 1997 and replaced by NULM (National Urban Livelihood Mission) in September 2013, aims to provide gainful employment to the urban unemployed and underemployed. The NULM will focus on organizing urban poor in SHGs, creating opportunities for skill development leading to market-based employment, and helping them set up self-employment ventures by ensuring easy access to credit. The mission aims at providing shelter with basic amenities to urban homeless. It also plans to address livelihood concerns of urban street vendors.
data-matched-content-ui-type="image_card_stacked"
Site Search
→ यूपीएससी वन टाइम रजिस्ट्रेशन (OTR)
→ एनसीईआरटी (NCERT Books)
→ IAS/IFoS Prelims Result 2023
→ IAS Exam Dates - 2024

UPSC Mains Exam Syllabus
» Indian Language, English & Essay
Books & Exam Papers
» Booklist for IAS Examination
» Previous Year Prelims GS Papers
» Previous Year Mains GS Papers
Download IAS Planner
General FAQs and Information about
UPSC Civil Services Examination
IAS Planner Android App
→ Download Now! ←
Go to Monthly Archive
Useful Tips & Articles
तैयारी कैसे करें? |
EXAM SUBJECTS |
STUDY RESOURCESDownload Free eBooks
|